")
“Those who have knowledge don’t predict. Those who predict don’t have knowledge.”
Lao Tzu (circa 6th century B.C.)
“It’s tough to make predictions, especially about the future.”
Yogi Berra
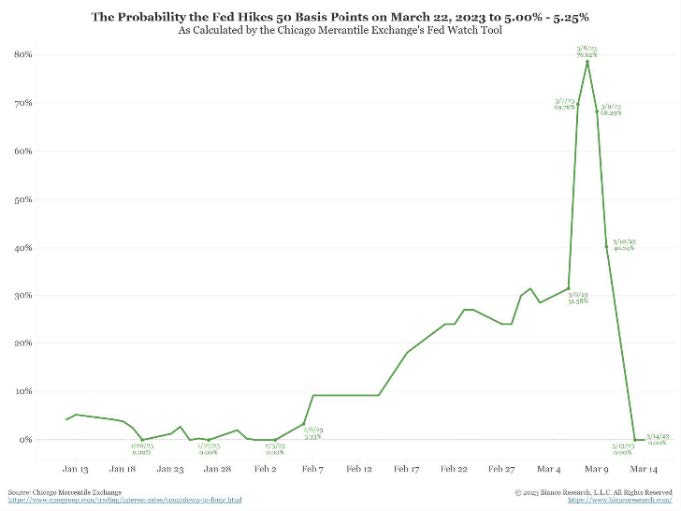
Market forecasters are often viewed as experts in their field, providing investors with crucial insights into future market trends. However, the reality is far from this idealized perception, as the recent quarter has exemplified the unpredictable nature of markets. Heading into 2023, most forecasters were certain we were headed for an imminent recession and market downturn. They were quickly proven wrong, with the S&P 500 rallying 9%, the economy adding 504,000 new jobs, and the unemployment rate dropping to 3.4%, a level last seen in 1969. Just as forecasters started to turn bullish, they were blindsided by Silicon Valley Bank, the largest US bank to collapse since the 2008 financial crisis, which added a fresh dose of uncertainty. The chart below exemplifies the challenges of forecasting, graphing the market-implied probability of the Fed hiking 50bps leading up to their March meeting. It certainly hasn’t been easy for forecasters.
The title “professional forecaster” is comedic; akin to someone calling themselves a professional fortune teller. Rather than relying on such unreliable predictions, investors should stick with a well-constructed investment strategy. Markets are highly uncertain in the short run, but over the long term they tend to reward investors who remain disciplined and patient. In the following section, we’ll look at forecasters’ historical track record (spoiler alert: it’s not good), after which we’ll describe our approach to investing in US equities.
Accuracy of Market Forecasts
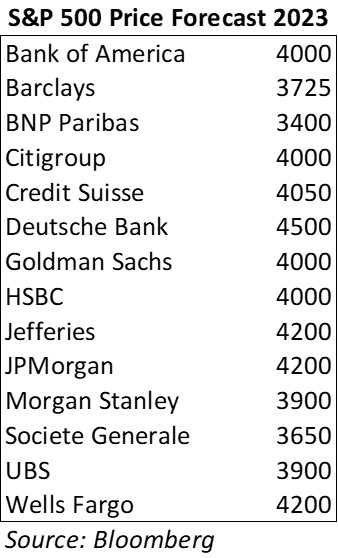
Bloomberg compiles S&P 500 price forecasts for the most notable strategists on Wall Street. The table below provides a sample of these forecasts for 2023. But before we put any stock in these predictions, a healthy dose of skepticism is in order. To gauge the accuracy of this cohort, we compared forecasters’ average projected return at the beginning of each year to the actual return of the S&P 500 for that year, dating back to 2000. The accuracy of forecasters has been dismal, with an average deviation of 15.6% between their projected return and the S&P 500’s actual return. This figure becomes even more concerning when compared to the S&P 500’s average annual price appreciation of 6%. A simple approach would have fared much better. From its inception in 1926 to 1999, the S&P 500 price index appreciated on average 6.3% per year. Had we used this historical average as our forecast for each year, our average deviation would have been 14.2%. Not great, but better than the “experts”.
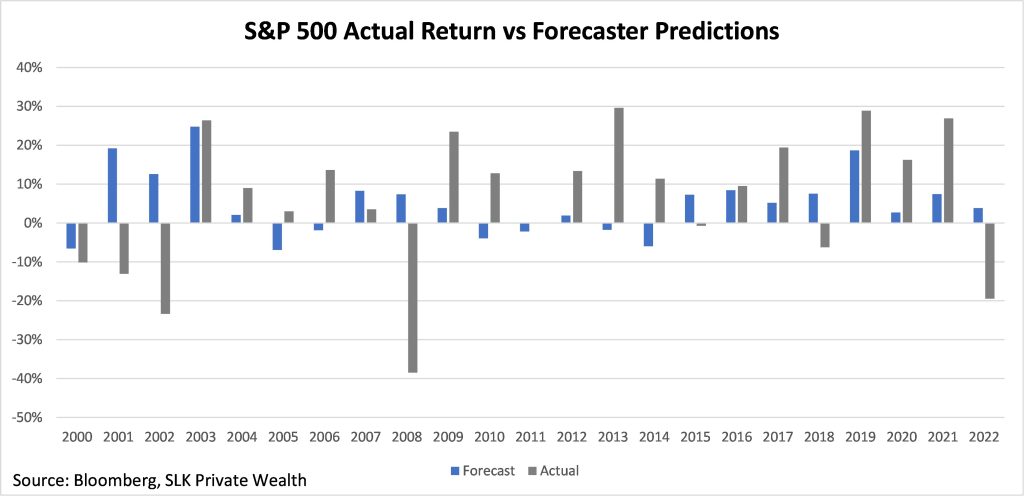
What makes matters worse is forecasters are notoriously terrible at predicting downturns, which is when investors need them most. For example, heading into 2008 the average forecaster predicted the S&P 500 would return 7% for the year. What transpired was the worst economic recession since the Great Depression, with the S&P 500 ending the year down 38%. That’s a 45% miss on a pivotal year! We saw this happen again in 2022, with the average forecaster predicting a 4% return on a year when the S&P 500 declined 19%.
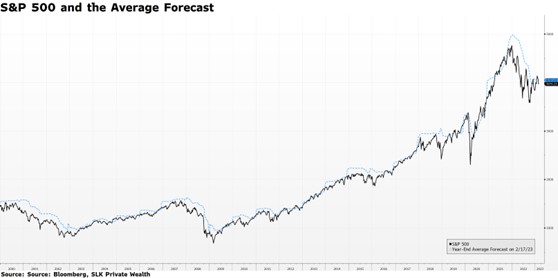
The trick forecasters employ is revealed in the chart below, which plots the S&P 500 index level against the average one-year forecast. If forecasters had any predicting power, the black line, representing the S&P 500, should follow the blue line, representing forecaster predictions. What we see is the blue line hovers just above the black line, indicating forecasters are simply applying a slight premium to what has already occurred, rather than providing genuine insight.
Why does anyone listen to forecasters? The unfortunate reality is the audience doesn’t hold them accountable. Forecasters know the name of the game is to sound smart, and if you’re right, tell everyone how right you were, and if you’re wrong, sweep it under the rug. Throughout history, if there is a demand for something, there sure will be someone to supply it, even if what’s being demanded isn’t attainable. As such, professional forecasters are much like fortune tellers. They may be good for entertainment, but not much else.
SLK’s Approach to US Equities
In his book The Wisdom of Crowds, James Surowiecki uncovered the striking revelation that large groups of individuals, lacking in specialized knowledge or expertise, can produce a collective intelligence that surpasses that of experts. Surowiecki provides several examples to support his thesis, ranging from the accuracy of jellybean counting competitions, where the average guess consistently outranks most individuals’, to the success of prediction markets in forecasting political events.
The implications of this idea extend to the world of investing, where the collective intelligence of the market is far more efficient at pricing information than most individuals. Rather than trying to outsmart the market, our strategy seeks to capitalize on inefficiencies that result from the behavioral shortcomings of market participants. We take advantage of these mispricings by orienting our portfolios towards high-quality, undervalued stocks with positive price momentum. As the chart below illustrates, stocks that rank favorably on value, momentum, and quality characteristics have outperformed over the past 50 years.
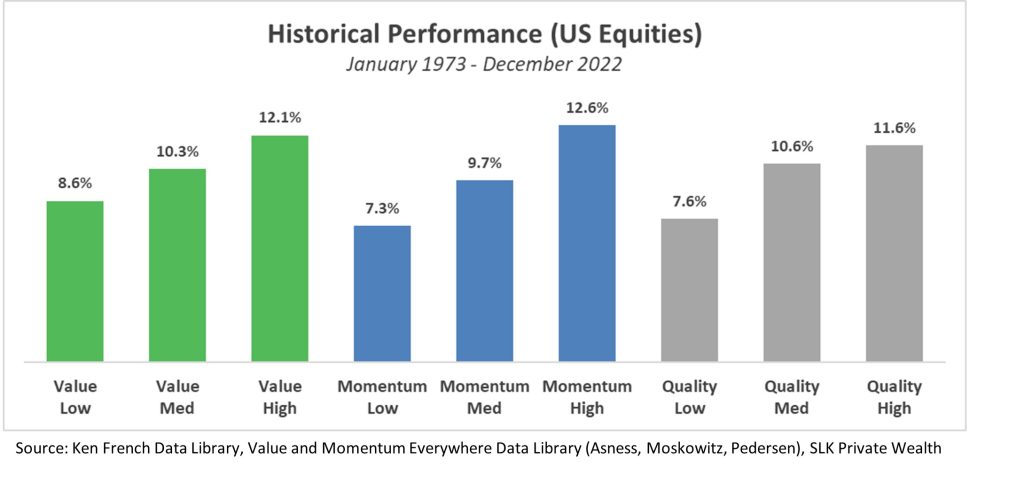
Pricing inefficiencies occur when participants are collectively biased in their estimates, a phenomenon that stems from cognitive and emotional biases that unconsciously influence individual reasoning. Value mispricings arise when investors become overly optimistic about a particular stock, driving prices up to unsustainable levels. Stocks with strong price momentum outperform because investors are slow at pricing in new information, anchoring their expectations to current levels. Lastly, high-quality stocks outperform because investors tend to overvalue speculative ventures over companies that generate sustainable earnings. These characteristics not only add value on a stand-alone basis, but also offer significant diversification benefits through integration. Value and Momentum, for example, are negatively correlated. This intuitively makes sense, as value stocks are likely cheap because they’ve recently declined in price (negative momentum), and vice versa. By integrating the three approaches, we harness their return potential while reducing the volatility of excess returns due to their complementary nature.
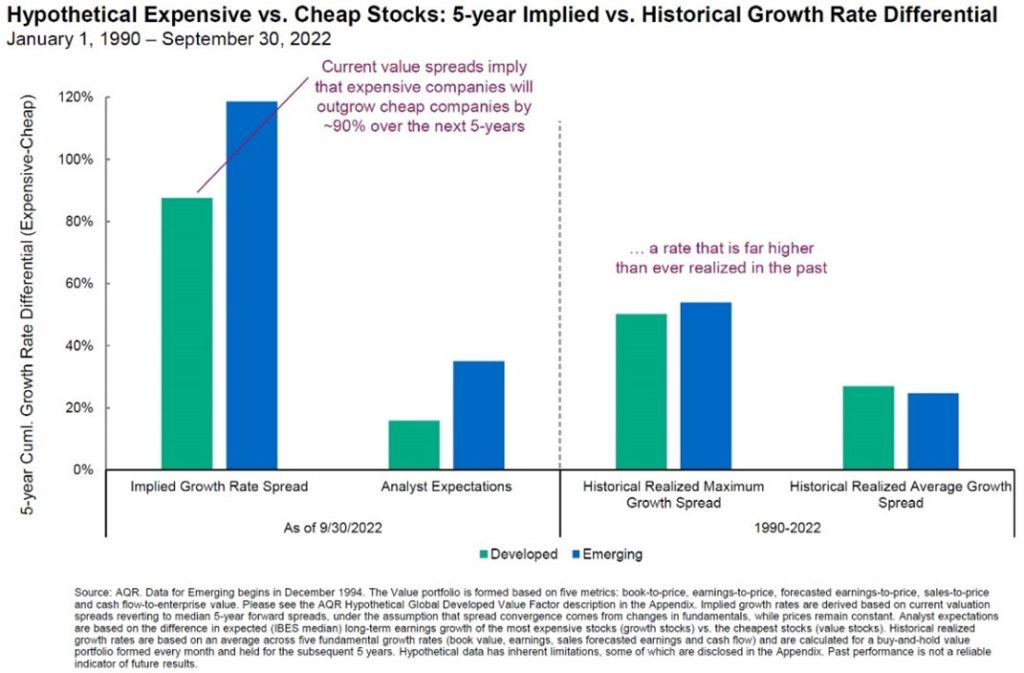
Our approach is especially appealing in today’s market, where investors are overly optimistic about the growth prospects of expensive companies. Current market prices imply that the earnings of growth-oriented businesses are expected to outgrow their counterparts by a staggering 90% over the next 5 years, which is twice the rate ever achieved by these types of businesses in any 5-year period, making it an improbable scenario.
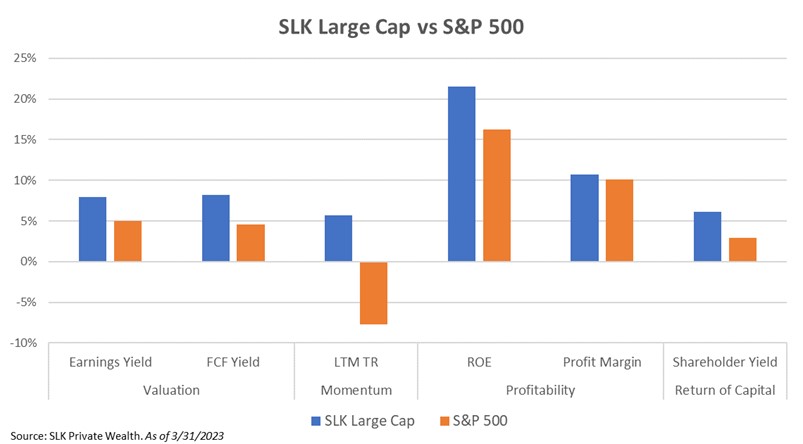
We evaluate the attractiveness of our portfolios relative to their benchmarks using value, momentum, and quality investment characteristics. Our SLK Large Cap Equity portfolio is 40% cheaper than the S&P 500 based on earnings yield and free cash flow yield. While the S&P 500 has experienced negative price momentum, our portfolio has positive technical support. We use profitability and return of capital as measures of quality. Our portfolio’s return on equity and profit margin, which are measures of profitability, surpass that of the S&P 500. Lastly, our portfolio’s shareholder yield, which measures the amount of capital companies return to their shareholders, is twice that of the S&P 500. In aggregate, our portfolio is cheaper, higher quality, and has stronger technical support than the market.
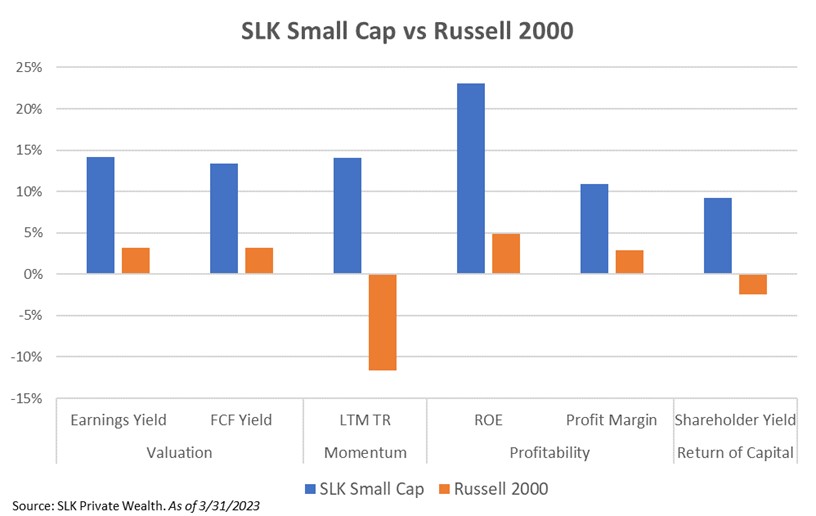
Our strategy kicks into higher gear with small caps, where the breadth of opportunities is significantly larger. SLK Small Cap is 75% cheaper than the Russell 2000, partly because 40% of the companies in the index are unprofitable. Whereas momentum has been a headwind for the index, it’s been a strong tailwind for our companies. When it comes to profitability, our companies are nearly 5 times more profitable than the index, with an ROE of 23% compared to 5%, and profit margins of 11% versus 3% for the index. Finally, over the last 12 months, our companies have returned 9% of capital back to investors in the form of dividends and buybacks, while the broader small cap market required 2% of additional funding which was raised through debt and equity issuance.
That’s just the tip of the iceberg for our strategy. There is a second half to our approach which incorporates sentiment and informed investor signals. We further add value in how we construct our portfolios, manage risk, and implement trades, all of which we would be delighted to share with those who are interested. For those interested in our assessment of macroeconomic conditions and our approach to alternative investments, we encourage you to visit our prior letters Managing Uncertainty and Fasten Your Seatbelts.
While uncertainty prevails in the current economic climate, we remain excited about the opportunities we are uncovering on a bottom-up basis. Most importantly, we remain committed to delivering exceptional investment solutions backed by robust empirical support.
Razmig Der-Tavitian, CFA, CAIA
Chief Investment Officer
SLK Private Wealth